The long march through the institutions in graphs.
Check out series by data scientist David Rozado series on Twitter, especially the updated graphs posted in August 2022.
* First, academic postmodernism’s high theory is developed in the late 1950s and into the 1960s, especially in philosophy.
* Second, it spreads through other humanities fields (Literature, History, Anthropology, etc.) in the 1970s and 1980s.
* Third, it transforms university curricula in the 1990s and 2000s, including in professional areas such as Education, Business, and Nursing.
* Fourth, it generates the cultural activists of the 2010s and 2020s who take the ideology into the workplace, the schools, and the streets.
Related: Explaining Postmodernism: Skepticism and Socialism from Rousseau to Foucault (audiobook). Also e-book and print versions.
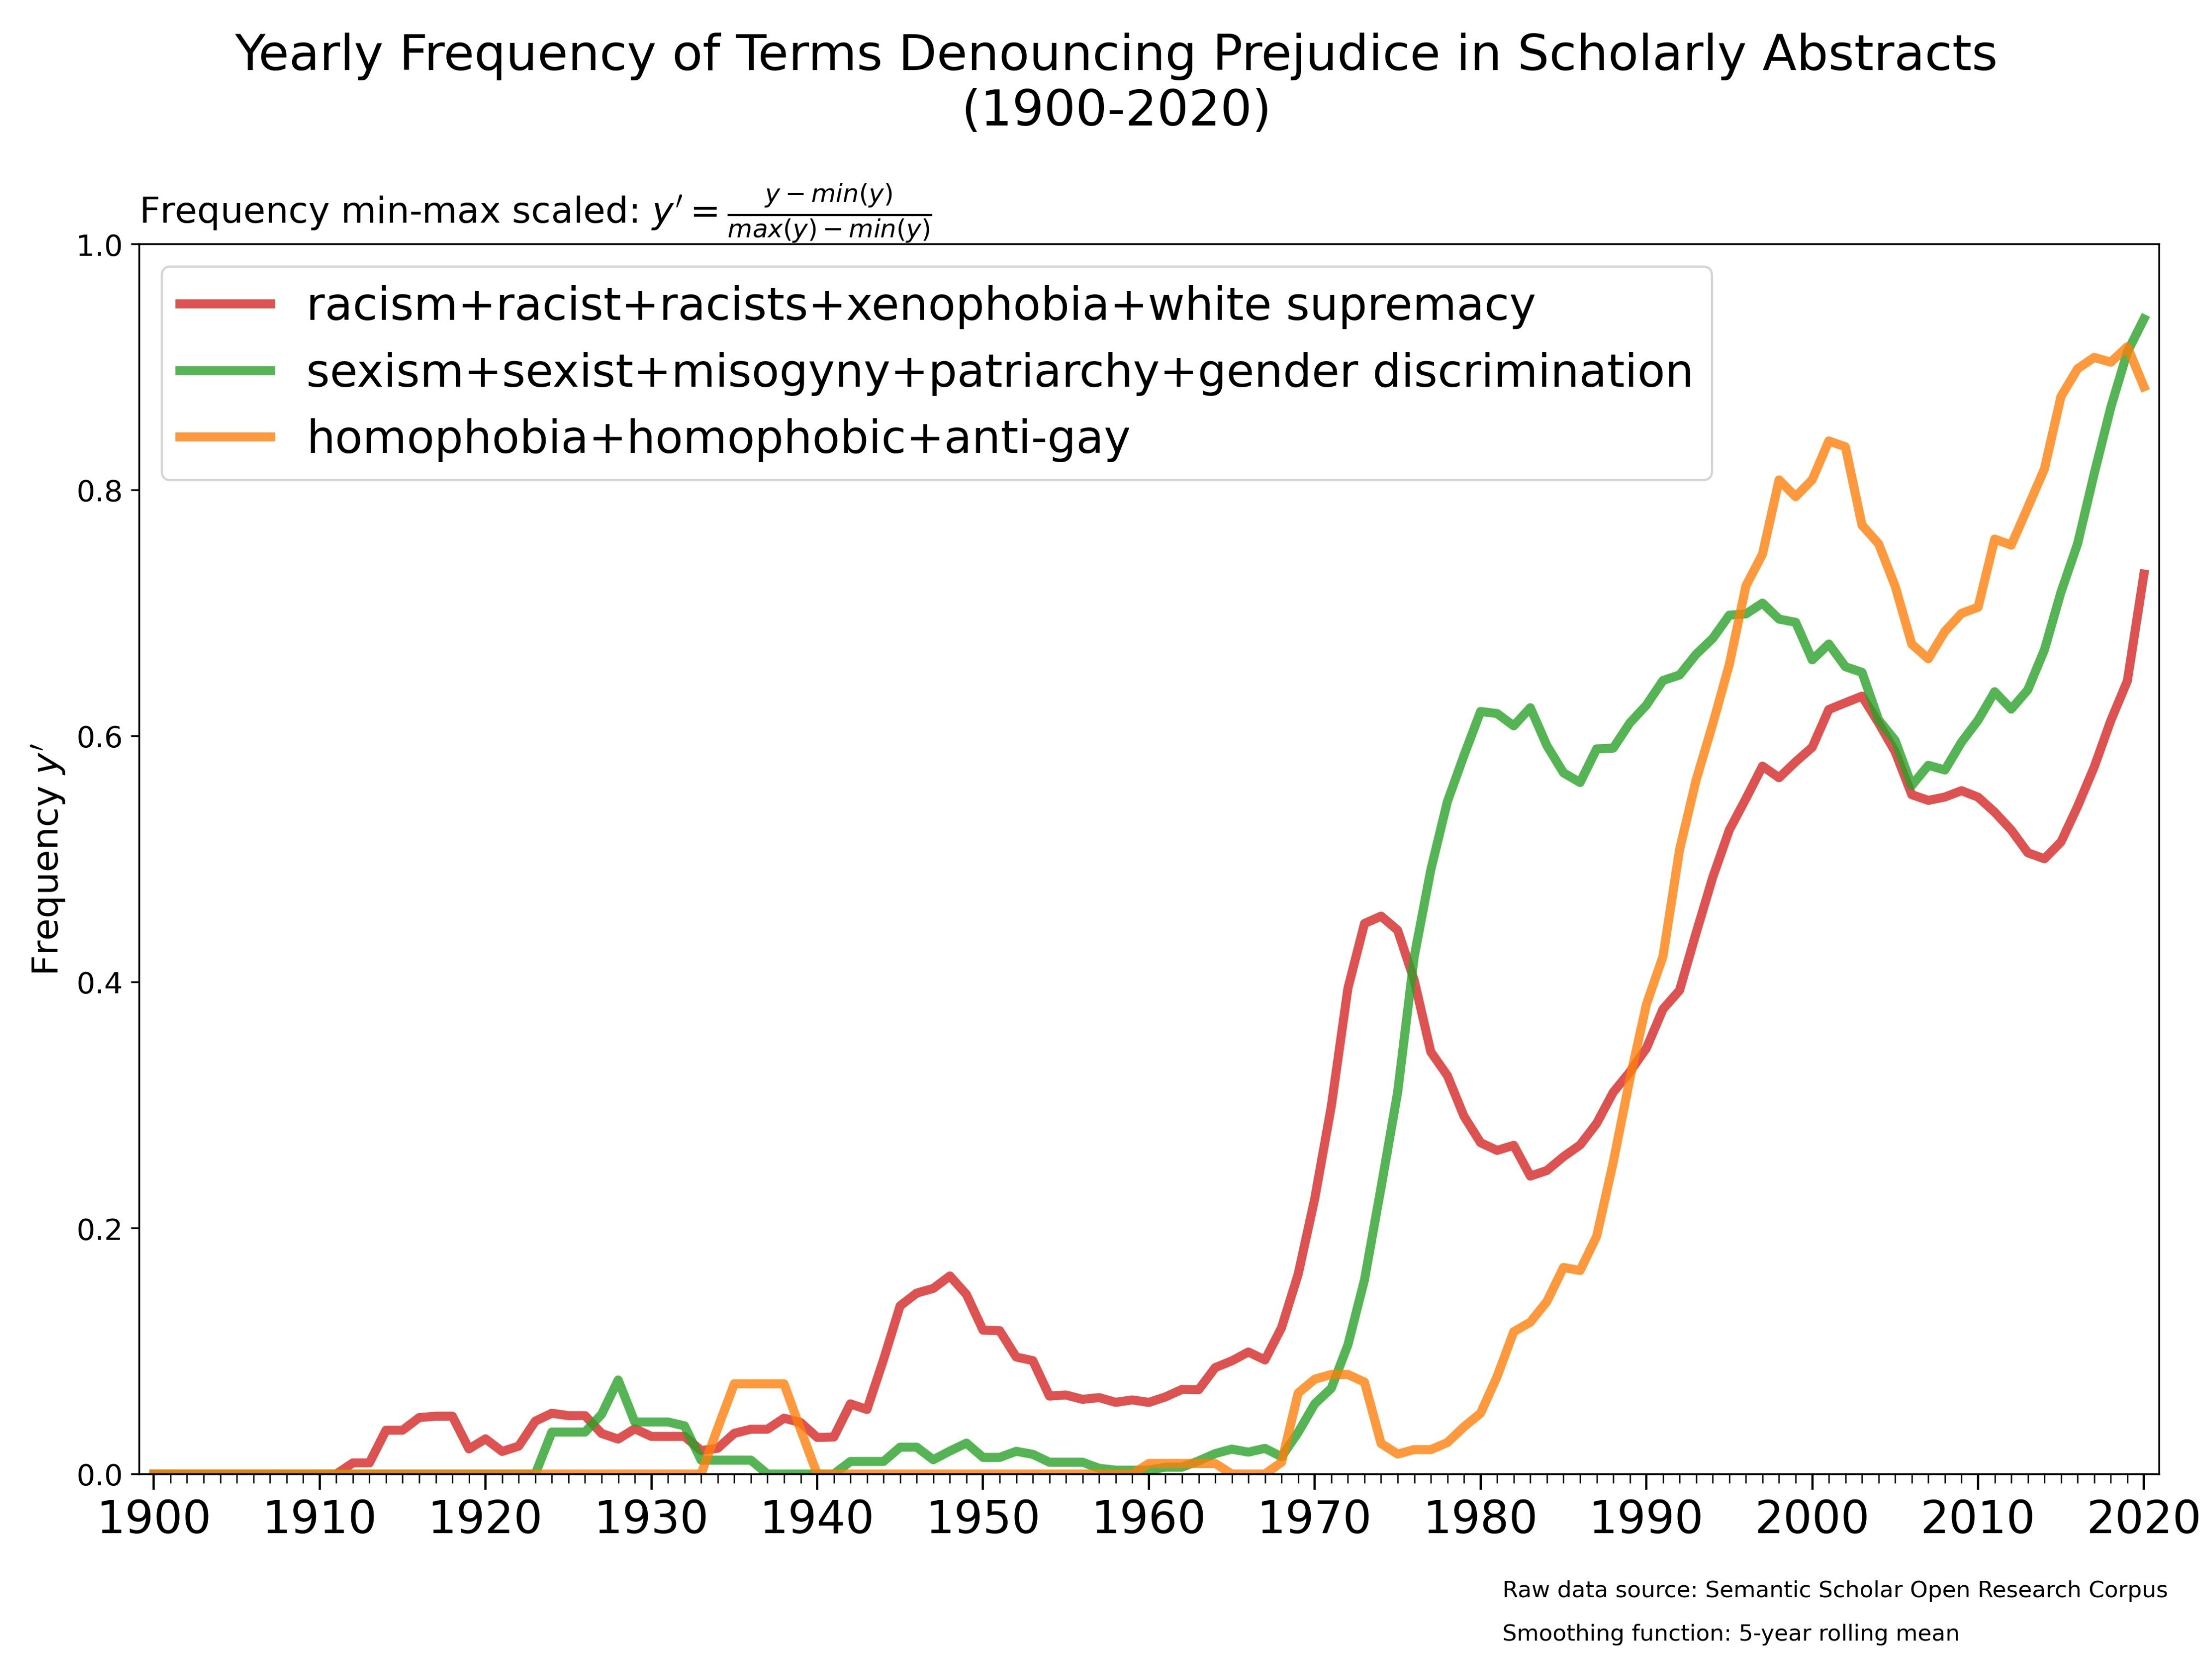
An intriguing graph. Seems concern about women’s rights soared in the seventies, and concern about LGBT rights soared at the time of the devastating AIDS epidemic and concern about oppression of Black and Brown People soared starting in the mid-1960’s
What stands out for me is that there are several instances where as one line rises another peaks and then temporarily fall. Thus in the 1970s sexism rises rapidly concurrent with a fall in racism. Then they both dip in relation to homophobia before all three rise together. The impression is of a ratchet effect.
Am I reading this right?
70-90% of all academic abstracts mention racism, sexism, or homophobia????
How can that be?????????????????