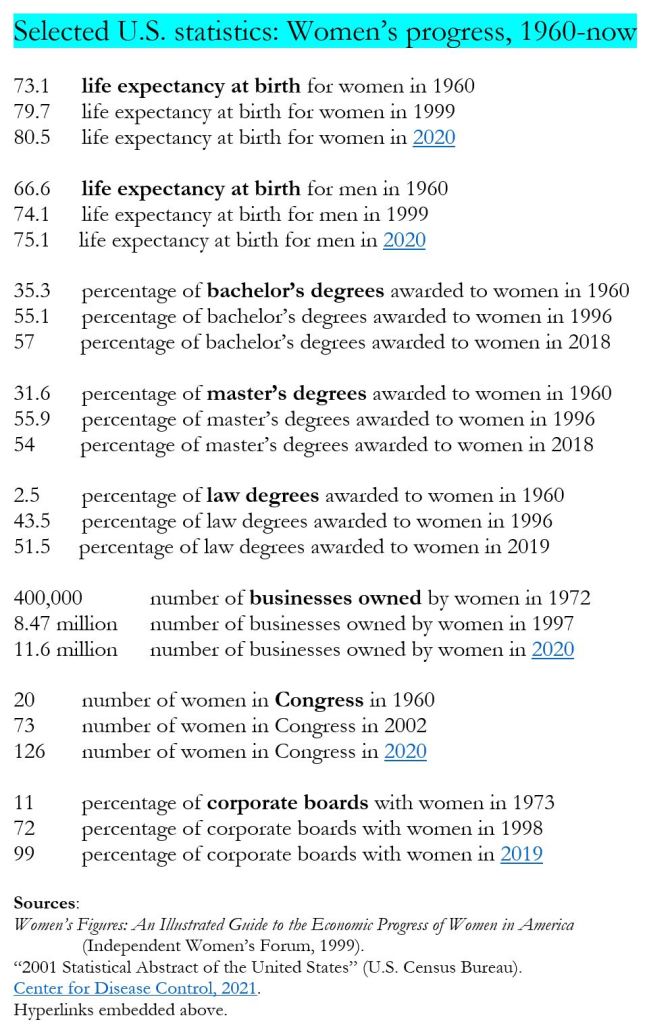
Selected U.S. statistics:
73.1 life expectancy at birth for women in 1960
79.7 life expectancy at birth for women in 1999
80.5 life expectancy at birth for women in 2020
66.6 life expectancy at birth for men in 1960
74.1 life expectancy at birth for men in 1999
75.1 life expectancy at birth for men in 2020
35.3 percentage of bachelor’s degrees awarded to women in 1960
55.1 percentage of bachelor’s degrees awarded to women in 1996
57 percentage of bachelor’s degrees awarded to women in 2018
31.6 percentage of master’s degrees awarded to women in 1960
55.9 percentage of master’s degrees awarded to women in 1996
54 percentage of master’s degrees awarded to women in 2018
2.5 percentage of law degrees awarded to women in 1960
43.5 percentage of law degrees awarded to women in 1996
51.5 percentage of law degrees awarded to women in 2019
400,000 number of businesses owned by women in 1972
8.47 million number of businesses owned by women in 1997
11.6 million number of businesses owned by women in 2020
20 number of women in Congress in 1960
73 number of women in Congress in 2002
126 number of women in Congress in 2020
11 percentage of corporate boards with women in 1973
72 percentage of corporate boards with women in 1998
99 percentage of corporate boards with women in 2019
Sources:
Women’s Figures: An Illustrated Guide to the Economic Progress of Women in America (Independent Women’s Forum, 1999).
“2001 Statistical Abstract of the United States” (U.S. Census Bureau).
Center for Disease Control, 2021.
Hyperlinks embedded above.