Some questions based on this chart (via Michael Strong):
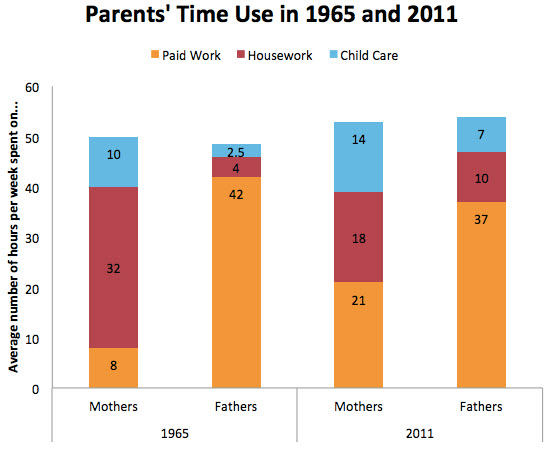
1. Households’ paid income increased by a combined six hours, from 50 to 56 hours per week of paid work. So are households richer by 12% or so?
2. Housework declined by a combined 10 hours per week. Are houses now dirtier or messier? Or has housework been outsourced more or the decline made possible by labor-saving devices?
3. Parents’ time spent with their kids increased by 8.5 hours per week. Does that mean more quality time or more helicoptering?
4. In 1965 moms’ house-and-kids-to-paid-work ratio was 4:1, and in 2011 it was 3:2. For dads the ratio changed from 1:6 to about 1:2. Will the trend toward 1:1 continue for both genders?
5. In these three measured categories, moms increased their time by two hours overall and dads increased by one hour overall. Did that come out of sleep time, leisure time, or what?
That was a draft post, for critical commentary to be published soon.
http://slatestarcodex.com/2017/02/09/considerations-on-cost-disease/
I know this is a test post and all, but this is relevant to the questions you ask.
Thanks. Tweeted it.